Live Data
Access to the live data is available here.
The data provided consists of:
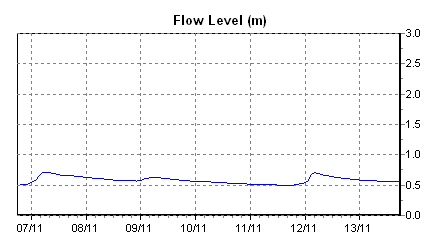
Water Level: Shows the changes in the depth of the water in the burn. After rain the depth of the burn will increase. Once the rain has stopped the level of the burn usually falls more slowly than the rise.
Temperature: Both air and stream water temperature are measured at the same site and plotted. During the summer months this usually shows a warming during the day and cooling at night. In the winter temperature can be affected by longer lasting periods of cold or warmer weather and are not so affected by day- night time differences.
Electrical conductivity: This gives an indication of how much material the river is carrying in dissolved form. The higher the conductivity the higher the concentration of solutes. Rainfall usually has a lower solute concentration than the stream so there is a reduction in Electrical Conductivity in the stream during rain/storm events.
Together this information provides a view of changes in the amount of water and the quality of the water going down the Tarland Burn.
Category: Live Data


